A week ago I gave a talk about Android performance, presenting some old and should-be-known-to-all-developers methods, aside to new tools introduced in Jellybean. The talk was recorded and here’s the video:
The slides are here.
I know that performance optimization tends to be pushed aside when developing a project, especially if you’re in a start-up company and all you do is pretty much “run” with the product.
On this post I’ll give you the tools **and knowledge **to easily do a performance review and solve common issues in your app, rising it up to the challenge of smooth running.
Let’s start:
Overdraw
Overdraw is a simple concept to understand and since Android 4.2 – it’s easy to detect.
Overdraw: drawing something on top of something else. If you draw a pink background and a button on top of it – you get an overdraw. That is because each pixel on the area of the button is drawn twice. Once in pink, when you draw the background, and another time in the button’s color when you draw the button. You cannot avoid overdraw completely. Overdraw up to 2x (=3 layers) on the whole screen is considered to be OK and depends on the GPU’s ability to draw all those pixels on the screen and still do that in 16ms per frame (thus achieving 60fps).
How to detect?
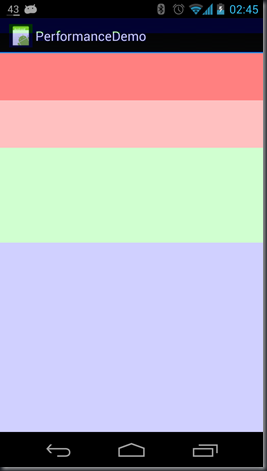
If you have Android 4.2 installed on your device, you can use the “Show GPU overdraws” under the Developer options. I wrote a small app to illustrate overdraw on my Performance Demo. The layout I created has a background color in white, on its upper half it has another layout with a white background and so on for this layout. The result - white screen, but with the “Show GPU overdraws” enabled we can see what really happens:
The blue color is 1x overdraw – every pixel got drawn twice in this area. The green color is 2x, light red is 3x and overdraw of 4x is on the stronger red color.
As a rule of thumb, you should have only up to small light red areas. If you get some 4x overdraws – you should probably consider reconstructing your layout hierarchy.
How to fix?
Well..it really depends on how your layout is built. You can go through your layout’s hierarchy and see for yourself if you can reconstruct it differently, eliminating some overdraws.
One popular optimization is removing the window background. There’s a default background for every Android app, so if your main layout has it’s own opaque background – there’s no need to draw the default one as well. That’s why on the image from Performance Demo you can see that the bottom half of the screen has 1x overdraw, even though we have only one layer of white background.
The solution is simply removing the background by setting the android:windowBackground attribute to @null on your theme, or calling getWindow().setBackgroundDrawable(null) on the Activity’s onCreate callback.
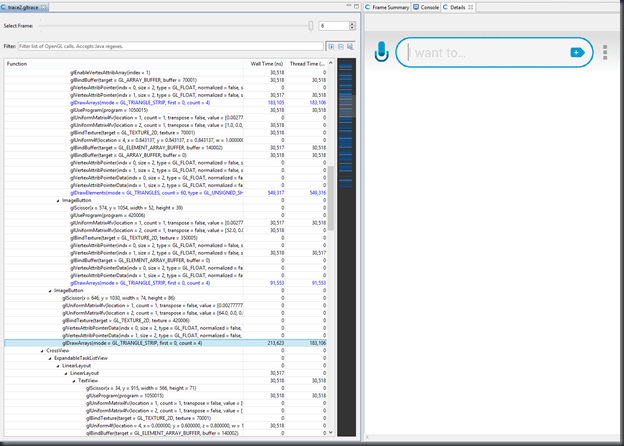
Another interesting way is to use Tracer for OpenGL that comes with the SDK and can be run from the Device Monitor. Since everything is ultimately translated to OpenGL commands, this tool will show you how your screen is drawn, step-by-step, component-by-component. Here’s an example of how it looks:
This is an example of running the tool on Any.DO’s main layout.
The tree on the left is the layout hierarchy and the OpenGL commands used to draw every component in it. The blue marked lines are the one that let you see the preview on the right, the image that got drawn up to this moment.
Going down the tree, you can spot 2 steps where the image on the right is the same, making you think if drawing the last component was really necessary. You can also spot components that got drawn but then got covered by another component, or “Overdraw”.
This tool requires you to connect a phone with JellyBean to your computer. The process is pretty heavy, but only a few frames are required in order to detect problems. You can read more about the process in the Official Android Blog.
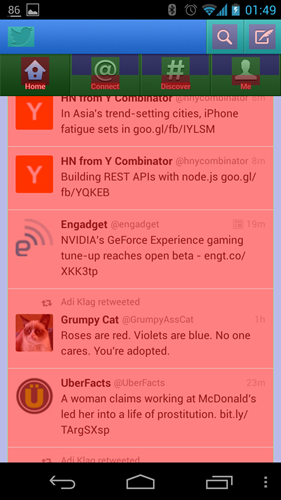
Here are some screenshots that proves nobody is saint:
Detect UI Glitches
If you’re using your app and it feels “un-smooth” but then again you’re not sure if it’s just your imagination - you can profile the GPU rendering of the last ~2 seconds to see if there are any glitches there.
For that, you need to first enable the “Profile GPU rendering” on your JellyBean device’s Developer options. After that you can use your app and whenever you want to get the profiling information, use the following adb command:
adb shell dumpsys gfxinfo com.your_package_nameYou’ll get a lot of info about the memory usage of the graphics, the display lists that used to draw this screen and the time, in milliseconds, it took the GPU to render every frame, divided to 3 phases:
Draw    Process Execute
1.56    1.89    1.16
1.46    2.01    0.85
1.59    2.17    0.89
1.19    1.83    0.85
0.82    1.13    0.58
0.49    0.82    0.43
2.08    2.35    1.13
0.98    3.51    0.92
0.58    1.19    0.49
0.40    0.76    0.37
1.10    2.59    0.98
0.98    1.92    0.82
1.07    2.01    0.82
...
The Draw part is the time it took to generate the Display Lists by running the onDraw() methods of the components. The Process part is the time it took the renderer to execute the display lists. More views = more time. The Execute part is the time it took to actually send the frame to the compositor. That’s when the back buffer is swapping with the front buffer to actually show the frame you just built.
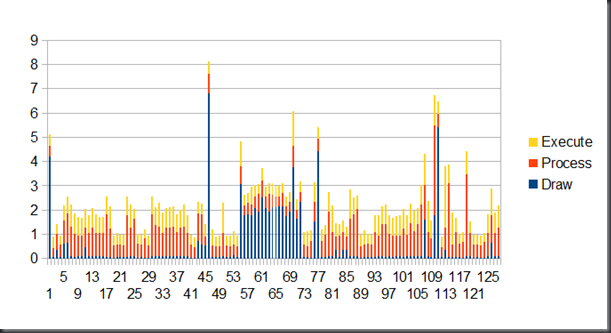
The Draw+Process+Execute should be <= 16 ms in order to run at 60fps. It’s easier to see that if you copy that table into a spreadsheet and create a stacked columns graph. Here’s a graph that I took from Any.DO:
The X coordinate is the frame number, the Y coordinate is the time in milliseconds it took to render the frame.
On those 2 seconds, taken from our new Any.DO Moment feature, I ran 2 hardware accelerated animations sequentially. We can see they both ran smoothly by the fact that all the frames took < 16ms to render. Another interesting observation is that the frames on each animation, frames 1-55 and 80-128 don’t have much time spent on Draw. It makes a lot of sense after understanding how Hardware Acceleration works. On these frames the onDraw() is only called when the view is invalidated, which is avoided by the use of Display Lists and hardware layers on the animated component. I highly recommend understanding the way hardware acceleration works for better understanding how your app views are rendered on the screen.
Systrace
Systrace is a great tool to get the execution times for your process and other system processes. It can be started from the DDMS and outputs a cool HTML that allows you to navigate the time line of all the processes that ran at that time.
Since Systrace is a powerful tool that requires experience to identify problems, I won’t elaborate on it here, but you’re welcome to read more about it on the Android site.
Hierarchy Viewer
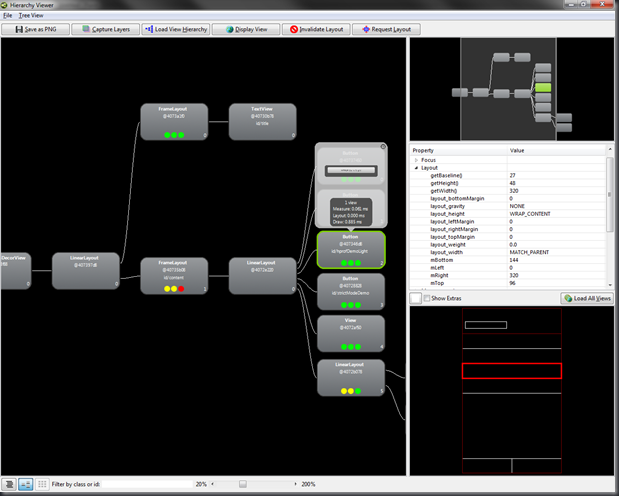
That’s a must-have tool for anyone who writes any layout on Android. Embedded in the Device Monitor, this tool shows the views tree of the currently presented layout on the device, and lets you analyze the time consumption for each component, and compare it to the other components. There are also good non-performance related information there, such as the components’ properties and the layout’s preview, allowing you to see where each component is positioned on the screen.
Method Profiling with Traceview
Traceview is such an important tool, that I expect from any good Android developer to know how to use it. You kick it from DDMS (“Start method profiling” button) or from code using the Debug class, and after stopping it you’ll get a list of all the methods that ran in that period of time.
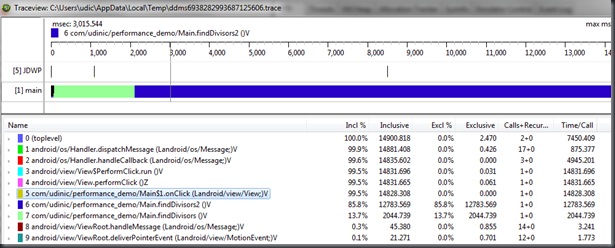
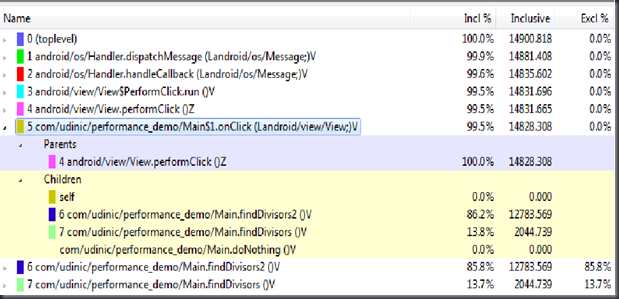
The important parts are the percentage of the time consumed by each method. Inclusive % means the running time percentage for this method AND its child functions. The Exclusive % means the same but only for the function itself, without its child functions. You can easily drill down on each function, and see which of its child functions took most of the running time, as demonstrated here:
On the picture above we can easily see that the onClick() method on the Main class took 99% percent of the running time, and its child function, findDivisors2(), was the heaviest inside it. We found the problem! now we can go to the function’s algorithm and try to make it to work faster.
The sample code for this experiment is on the Performance Demo project.
But what will happen if your code seems to run just fine, but the Garbage Collection seems to take a lot of CPU time? This can be seen on Traceview by seeing something like this:
or from Logcat by seeing too much of this:
D/dalvikvm(13488): GC_CONCURRENT freed 458K, 5% free 10497K/10988K, paused 3ms+3ms, total 40ms
D/dalvikvm(13488): GC_CONCURRENT freed 352K, 4% free 10671K/11060K, paused 3ms+2ms, total 39ms
D/dalvikvm(13488): GC_CONCURRENT freed 554K, 6% free 10729K/11324K, paused 5ms+4ms, total 46ms
D/dalvikvm(13488): GC_CONCURRENT freed 547K, 6% free 10810K/11404K, paused 4ms+3ms, total 39ms
D/dalvikvm(11408): GC_CONCURRENT freed 1441K, 11% free 12659K/14180K, paused 4ms+7ms, total 66ms
D/dalvikvm(11408): WAIT_FOR_CONCURRENT_GC blocked 37ms
D/dalvikvm(11408): GC_FOR_ALLOC freed 1256K, 12% free 12503K/14180K, paused 56ms, total 56ms
D/dalvikvm(11408): GC_CONCURRENT freed 1009K, 10% free 12788K/14180K, paused 9ms+6ms, total 70ms
This means that our GC is working too hard on cleaning, which could indicate you allocate too many objects for it to handle quickly.
Helping out the GC
How do we know what objects we create too much of? Where should we even begin looking? Let’s get familiar with some useful tools:
Allocation Tracker
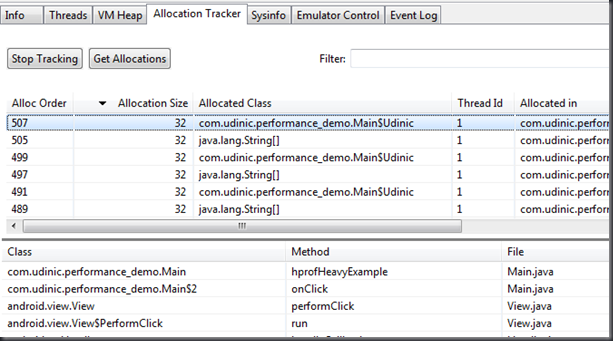
The Allocation Tracker comes with DDMS and it’s simple and very powerful:
After you start tracking the allocation, using the “Start Tracking” button, you can get the currently allocated object at any time by clicking the “Get Allocations” button. The list of allocated object will be loaded with sweet info like allocation size, and a stacktrace for the location where each object was allocated, giving you the power to catch that punk who’s creating all those String[] objects.
Eclipse MAT
The Eclipse Memory Analyzer Tool is a tool which gets an HPROF file, and analyze it.
HPROF is a standard for presenting heap memory snapshot from the JVM. You can dump an HPROF file from within the DDMS, or by code. The problem is, There aren’t any good HPROF analyzers for the Dalvik VM heap dumps (which is the one we just got from the DDMS). Alternatively, J2SE, the standard Java for desktops and servers, has been here for a longer period and has great tools to analyze its HPROF dumps. Luckily for us, the Android gods sent us the hprof_-conv_ (bundled in the Android SDK) which converts that alien dump to something J2SE analyzers can read. So, after dumping the heap info using the code or DDMS using this button:

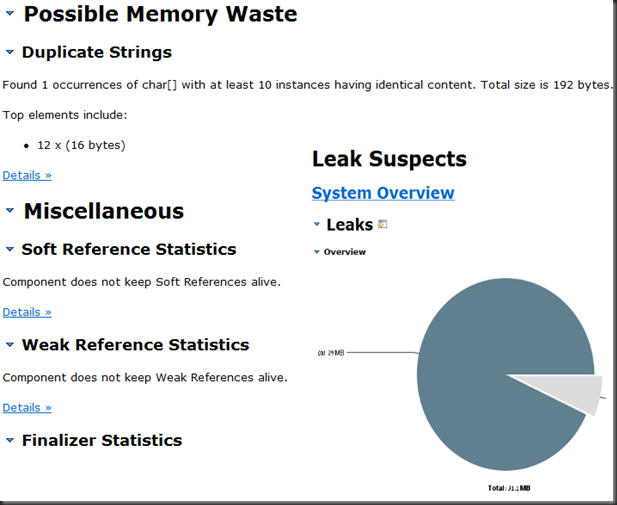
We’ll use the hprof-conv tool to convert from Android’s HPROF file, to a standard HPROF file. After that, we’ll open the file in Eclipse MAT, and we can get some cool reports like this:
We can see all the data in different views: Histogram view allow us to see all the classes and how many objects each one has. That why it’s easy to see if the GC got overdosed by a particularly class.
Dominator tree is showing who has reference to who. It’s also called the keep-alive-tree since the dominating object is the reason all its descendants are not cleaned by the GC.
You can also run queries on the data and search for objects that has some properties (e.g. String objects that has the same string in it).
Bitmaps allocation tips
Since bitmaps are the cause for many memory issues, I decided to bring up a few tips of my own specifically for that:
-
inJustDecodeBounds – This option can be set on the BitmapFactory in order to load just the meta data, like the bitmap’s dimensions. This is useful if you don’t know the size of the bitmap and might need to scale it down to fit your ImageView. This way you avoid allocating a big bitmap just to scale it down later.
-
inBitmap – Another attribute that can be set on the BitmapFactory.Options, allowing you to pass an already allocated bitmap to reuse when decoding a new bitmap. There are some restrictions when doing that, so you better read a little before using it.
-
inSampeSize – This option, when passed a value > 1, will get the bitmap decoder to output a smaller bitmap by the factor of the value you set. It’s good for previews and thumbnails. This is done more efficiently than allocating a bitmap and scaling it down.
Hardware Acceleration
I can write an entire post just about this, but I think it’s better for you all to read about it and watch some talks about it, to fully understand how it works.
When using hardware acceleration, you can use layers to accelerate your animations.
A layer is a texture of the animated component, performing the animation on it will be more efficient because the animation framework doesn’t redraw the component every frame, it only animate the layer we created. Think of it as taking a bitmap of your component and move/fade it instead of doing that to all the views in the component we animate.
You can use layers in software or in hardware. When you’ll use a hardware layer, the texture will be saved inside the GPU, causing all the manipulations on it (move, fade, rotate etc.) run very efficiently. Here’s an example of how to do this:
mCurrentPanel.setLayerType(View.LAYER_TYPE_HARDWARE, null);
ObjectAnimator animator = ObjectAnimator.ofFloat(mCurrentPanel, "translationY", 0, 100);
animator.addListener(new Animator.AnimatorListener() {
			...
                    @Override
                    public void onAnimationEnd(Animator animation) {
                        mCurrentPanel.setLayerType(View.LAYER_TYPE_NONE, null);
                    }
});
animator.start()
We set the layer type for our component, mCurrentPanel, and we add a listener to the end of the animation, to remove that layer. The layer needs to be removed in the end because the GPU’s memory is limited, so cleaning is required.
Want more?
All the code that I used to demonstrate the performance issues is on my GitHub’s SmallExamples repository.
Here are some links to more information on this subject:
Google I/O 2012: For Butter or Worse: Smoothing Out Performance in Android UIs – great talk about Hardware acceleration and pretty much all the tools I mentioned here.
Android performance case study – a blog post about a step-by-step process it took Google framework developer, Romain Guy, to find performance issues on his favorite (and mine) twitter client.
Google I/O 2010: Writing zippy Android apps – a pretty old talk, but it has cool demonstrations for common performance issues.
Google I/O 2011: Memory management for Android Apps – a good talk about memory management and how to find problems using Eclipse MAT
Memory Analysis for Android Applications – a blog post by one of the Android engineers.
In conclusion
Measure –> Profile –> optimize –> Measure again.
Simple as that.
If you have performance tips of your own – please write them in the comments to this post.
